for geog of europe kmz
Posted in Uncategorized
Lab 7
Data Classifications and Mapping
In this lab we are working on creating the maps for our animation. It is both interesting and tedious. Its interesting because you can visually see the changes that have occurred over time. BUT, it can be tedious too because its the same thing over and over. After a little bit I got into a groove and things went smoothly.
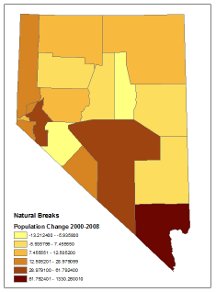
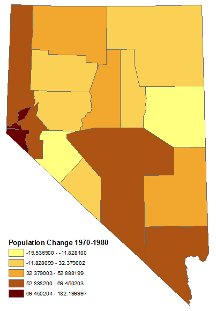
The maps in the gallery below show the percent of population changes that occurred during each decade. There also 3 maps that show the same decade but in 3 different classifications. This creates a lot of differences in the way the maps look. It does however show how you can a large variety in output from the same data.
If you click on each map in the gallery it will take you to a larger map.
-

- natural breaks 2000-2008
-
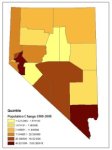
- quantile 2000-2008

-

- equal interval 2000-2008

-

- Percent chgange 1900-1910

-

- Percent chgange 1910-1920

-

- Percent chgange 1920-1930

-

- Percent chgange 1930-1940

-

- Percent chgange 1940-1950

-

- Percent chgange 1950-1960

-

- Percent chgange 1960-1970

-

- Percent chgange 1970-1980
-

- Percent chgange 1980-1990

-

- Percent chgange 1990-2000

-

- Percent Change 2000-2008

Posted in Uncategorized
Geovisualization with 3DEM
I had some difficulties with the Seamless National Data Server. The first area of Nevada that I chose did not have both the DEM and DRG. It me several tries to figure out the problem and I eventually chose a different location. Once I had a location with both types of files it went fairly smooth.
3DEM was fun to play around with. In 3DEM depending on how you adjusted the hillshading it would change the appearance of the topography. With certain settings it made the mountain range I had chosen look like a valley. The DRG topo overlay was very interesting. And the 3D fly over was very cool.
DEM files are digital elevation models. According to USGS DEMs are “digital representations of cartographic information in a raster form.” They are created using remote sensing techniques.
DRG files are digital raster graphics. The USGS website says that a DRG is a scanned image of a USGS standard series topographic map. The image inside the neatline is georeferenced and fit to the UTM.
Posted in Uncategorized
Lab 5
Today we are continuing the thrilling process of data processing.
After selecting the counties for Nevada and making a new layer I get to change the projection.
I played around with all of the different projection to see what they looked like. I settled on the USA contigious Albers Equal Area Conic USGS version. I chose this one mainly because I liked the way it looked. A lot of the different projections make it look like the top of Nevada was really narrow. It just didn’t look right.
After joining tables the attribute table turned mu null fields with 10 9s in them to 1000000000. Had to go back and change it to 9 9s as it requested.
MAKE SURE YOU HAVE YOUR FIELDS IN THE CORRECT ORDER WHEN CALCULATING!!!!! I goofed and ended up with all my percentages VERY negative. Had to go back and redo them the RIGHT way.
Over all it wasn’t to bad.
ArcGIS terms
Join Function –
- Appending the fields of one table to those of another through an attribute or field common to both tables. A join is usually used to attach more attributes to the attribute table of a geographic layer.
- Connecting two or more features from different sets of data so that they become a single feature.
Monitor Fire – what happens when you get REALLY frustrated.
Calculate/Field Calculator – lets you perform simple as well as advanced calculations on all or selected records. In addition, you can calculate area, length, perimeter, and other geometric properties on fields in attribute tables.
Posted in Uncategorized
Lab 4


Today we played around with ArcGIS.
I really liked this lab. I like playing around and creating the different types of maps.
These maps where created with ArcGIS. The Nevada map in shades of pink is of the number of married people in census tract, the blue map is the Number of people per sq mile in each census tract. The third map is of the world population.
Exploring on ESRIs web site was interesting. I liked how in the ‘News’ tab there are links to follow ESRI on the various social networking sites. It also convient on that page that you can subscribe to different ESRI publications. Another interesting thing on ESRI is the traingin page. They offer a lot of classes to help you learn more about how to use different aspects if ArcGIS I really like that there are even free classes.
I really like the search help feature.
My initial impression of ArcGIS is that it is fairly user-friendly for the amount of technical difficulty it contains.
Posted in Uncategorized
Lab 3
Lab 3 was transforming data from txt files to excel.
It wasn’t to hard. The worst was realizing that i saved that data with the estimated populations for 2008 in a pdf chart, not a txt file. Since there are only 17 counties in Nevada I just typed the info into the column.
If I was working on a large project like all the counties in the US of even a state with a lot of counties, like Ohio, I would have gone back to the internet and resaved the info in a txt file.
I think that transforming data like this isn’t difficult, but you do have to be careful that you don’t mess uop your data during the process.
Posted in Uncategorized
Lab 2
This lab has taken forever.
I think I may just hate HTML. Glad I’m not going into programming. Makes me want to throw the computer out the window.
The biggest problem was getting the school to allow me on my web space.
Working now and looks pretty good.
Posted in Uncategorized
Lab 1 – 1/21/10
1/21/10
Yahoo Directory Search Path
Government
US Government
Agencies
Independent Agencies
Not there
US Government
Statistics
US Census@
Census Bureau
Once on the Census web page I went to American Fact Finder. In American Fact Finder it was easy to find the population data for counties in Nevada for the 2000 census. It was more difficult for the historical data. I went back to the main census page and did a search query for “Nevada historical population”. The search gave me a link to the Nevada State and County Quick facts page. From there I found the page for historical population in Nevada. All of the data is conveniently on one page arranged in columns.
Historical Data -> http://www.census.gov/population/cencounts/nv190090.txt
Looking with Keyword searches on Google is a little more time consuming. It was easy to find population data. There are plenty of sites that link to government or research data. But when it came to find info on tranquility, fulfillment, etc it was more difficult.
When I searched for “Nevada tranquility levels” I got a lot of hits for a Vegas based band called “Tranquility Base”. There are also several housing developments named Tranquility something. Apparently there a lot of “fulfillment centers” in Nevada. It is a lot harder to find information on more abstract things.
Sites with population Info
QuickFacts Page ->http://quickfacts.census.gov/qfd/states/32000lk.html
US Health and Human Services state profile -> http://hab.hrsa.gov/stateprofiles/states/nv/State-Population-Data.htm
Census Pop Projections -> http://www.census.gov/population/www/projections/statepyramid.html
Nevada State Library -> http://nevadaculture.org/nsla/index.php?option=com_content&task=view&id=1016&Itemid=175
Sites with Info on State
http://nevada-history.org/county.html
http://www.50states.com/nevada.htm
http://quickfacts.census.gov/qfd/states/32000.html
http://www.library.unlv.edu/govpub/index.html
http://www.nsbdc.org/what/data_statistics/demographer/
Sites about population trends
http://www.centerwest.org/futures/archive/people/population_nv.html
wrdc.usu.edu/files/uploads/Population/Nevada_WEB.pdf ->PDF saved in data folder
http://www.nevadaappeal.com/article/20100110/BUSINESS/100109615/1005&parentprofile=1058
http://pewsocialtrends.org/maps/migration/
http://www.prweb.com/releases/2005/01/prweb197340.htm
Historic places and Places of Interest
Posted in Uncategorized
Hello world!
This is where I will be talking about the fun and trouble of creating a website. Stay tuned for more to come…..
Posted in Uncategorized
